ProjectPlan_GANTT_CHart_MatplotlibThe problem: You need a quick Gantt chart for a quick proposal report and you dint have any project planner software installed.

Solution:

While there are many different ways, you only have access to python, well Here’s a simple Gantt chart plotter with just matplotlib.

Not for rigorous use but a good substitute to make quick Gantt plot for quick report.


"""
GANTT Chart with Matplotlib
Sukhbinder
Inspired from
Gantt Charts in Matplotlib
""" import datetime as dt import matplotlib.pyplot as plt import matplotlib.font_manager as font_manager import matplotlib.dates from matplotlib.dates import WEEKLY,MONTHLY, DateFormatter, rrulewrapper, RRuleLocator import numpy as np def _create_date(datetxt): """Creates the date""" day,month,year=datetxt.split('-') date = dt.datetime(int(year), int(month), int(day)) mdate = matplotlib.dates.date2num(date) return mdate def CreateGanttChart(fname): """ Create gantt charts with matplotlib Give file name. """ ylabels = [] customDates = [] try: textlist=open(fname).readlines() except: return # for tx in textlist: if not tx.startswith('#'): ylabel,startdate,enddate=tx.split(',') ylabels.append(ylabel.replace('\n','')) customDates.append([_create_date(startdate.replace('\n','')),_create_date(enddate.replace('\n',''))]) ilen=len(ylabels) pos = np.arange(0.5,ilen*0.5+0.5,0.5) task_dates = {} for i,task in enumerate(ylabels): task_dates[task] = customDates[i] fig = plt.figure(figsize=(20,8)) ax = fig.add_subplot(111) for i in range(len(ylabels)): start_date,end_date = task_dates[ylabels[i]] ax.barh((i*0.5)+0.5, end_date - start_date, left=start_date, height=0.3, align='center', edgecolor='lightgreen', color='orange', alpha = 0.8) locsy, labelsy = plt.yticks(pos,ylabels) plt.setp(labelsy, fontsize = 14) # ax.axis('tight') ax.set_ylim(ymin = -0.1, ymax = ilen*0.5+0.5) ax.grid(color = 'g', linestyle = ':') ax.xaxis_date() rule = rrulewrapper(WEEKLY, interval=1) loc = RRuleLocator(rule) #formatter = DateFormatter("%d-%b '%y") formatter = DateFormatter("%d-%b") ax.xaxis.set_major_locator(loc) ax.xaxis.set_major_formatter(formatter) labelsx = ax.get_xticklabels() plt.setp(labelsx, rotation=30, fontsize=10) font = font_manager.FontProperties(size='small') ax.legend(loc=1,prop=font) ax.invert_yaxis() fig.autofmt_xdate() plt.savefig('gantt.svg') plt.show() if __name__ == '__main__': fname=r"projectChart.txt" CreateGanttChart(fname)

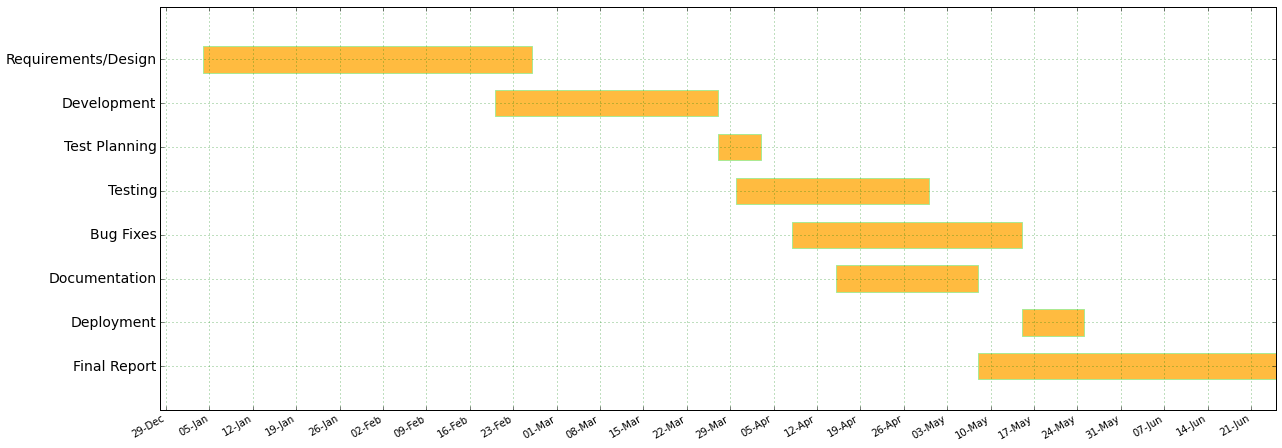
Example of the project text file used by the above program is

Requirements/Design,04-01-2016,26-02-2016
Development,20-02-2016,27-03-2016
Test Planning,27-03-2016,3-04-2016
Testing,30-03-2016,30-04-2016
Bug Fixes,08-04-2016,15-05-2016
Documentation,15-04-2016,08-05-2016
Deployment,15-05-2016,25-05-2016
Final Report,8-05-2016,25-06-2016

19 responses to “Quick Gantt Chart with Matplotlib”

  1. inputs?

    Like

    1. Perry

      Input is a text file. A sample text file is presented at the end of the post.

      Thanks

      Like

      1. Hi Sukhbinder,
        The error i get when i place the text file into the function _create_date is: ValueError: need more than 1 value to unpack

        Like

  2. I think the text file has some extra lines at the end. That might be causing the problem.

    Does this help. I am not getting error on my iPad or laptop.

    Thanks

    Like

    1. day,month,year=datetxt.split(‘-‘)
      Traceback (most recent call last):
      File “”, line 1, in
      ValueError: need more than 1 value to unpack

      Like

  3. this is the text file i am using:
    Requirements/Design,04-01-2016,26-02-2016
    Development,20-02-2016,27-03-2016
    Test Planning,27-03-2016,3-04-2016
    Testing,30-03-2016,30-04-2016
    Bug Fixes,08-04-2016,15-05-2016
    Documentation,15-04-2016,08-05-2016
    Deployment,15-05-2016,25-05-2016
    Final Report,8-05-2016,25-06-2016

    Like

  4. Input looks fine. Don’t know. Are you using a Linux system. Because that’s the system. I haven’t tested this code.

    Liked by 1 person

    1. hi sukhbinder!
      yes using linux

      Like

  5. i have tried 2 methods: 1. save the input as a txt file and feed it into the function _create_data; 2. feed str into the function. by using the 2nd method this is the error:

    datetxt=’Requirements/Design,04-01-2016,26-02-2016 Development,20-02-2016,27-03-2016 Test Planning,27-03-2016,3-04-2016 Testing,30-03-2016,30-04-2016 Bug Fixes,08-04-2016,15-05-2016 Documentation,15-04-2016,08-05-2016 Deployment,15-05-2016,25-05-2016 Final Report,8-05-2016,25-06-2016′
    >>> day,month,year=datetxt.split(‘-‘)
    Traceback (most recent call last):
    File “”, line 1, in
    ValueError: too many values to unpack

    Need help!!!!

    Like

  6. Hello,
    Thanks a million for the code. I modified it a lot to make it fit my application, but it was a really good base for learning Gantt and pyplot. Keep up the good work!

    Like

    1. Thanks Sarmad!! Any chance you can post yor mods..

      Like

  7. Victor Cesar Martins de Aguiar Avatar
    Victor Cesar Martins de Aguiar

    How about discontinuous tasks? For example:

    Let’s say that Task 1 starts at t1 and ends at t2, but this same task starts again at t3 and ends at t4. How to?

    Like

    1. Sorry. This was implemented for a simple use case that I needed at that time. Please feel free to extend and link back on any extended functionality.

      Like

  8. distruzio@libero.it Avatar
    distruzio@libero.it

    I cannot download the demo txt file

    Like

    1. Hi please copy paste the content of the files and save them as txt file. That should work

      Like

  9. Is it possible to add labels on the bars?

    Like

  10. Thanks a lot for your inspiration! It helped me to create my own Gantt Chart.

    Like

    1. Great!!! Good to know that…

      Like

Leave a comment

Trending